
Short answer: to calculate the standard deviation in Excel, select an empty cell, type =STDEV.S(A2:A11) (use the cells that hold your numbers) and press Enter. Use STDEV.S when your numbers are a sample of a bigger group, and STDEV.P when they are the entire population. With Microsoft’s own example data, STDEV.S returns 27.46391572 and STDEV.P returns 26.05455814.
Every fact here comes from Microsoft Support’s Excel function pages, checked in November 2026. The functions work in Excel for Microsoft 365 on Windows and Mac, and in Excel 2024, 2021, 2019 and 2016.
- A sample: =STDEV.S(A2:A11), the “n-1” method
- The whole population: =STDEV.P(A2:A11), the “n” method
- Count TRUE and FALSE in the cells too: STDEVA or STDEVPA
- Older workbooks: STDEV and STDEVP still work, but Microsoft recommends the new functions
Table of Contents
What is standard deviation in Excel?
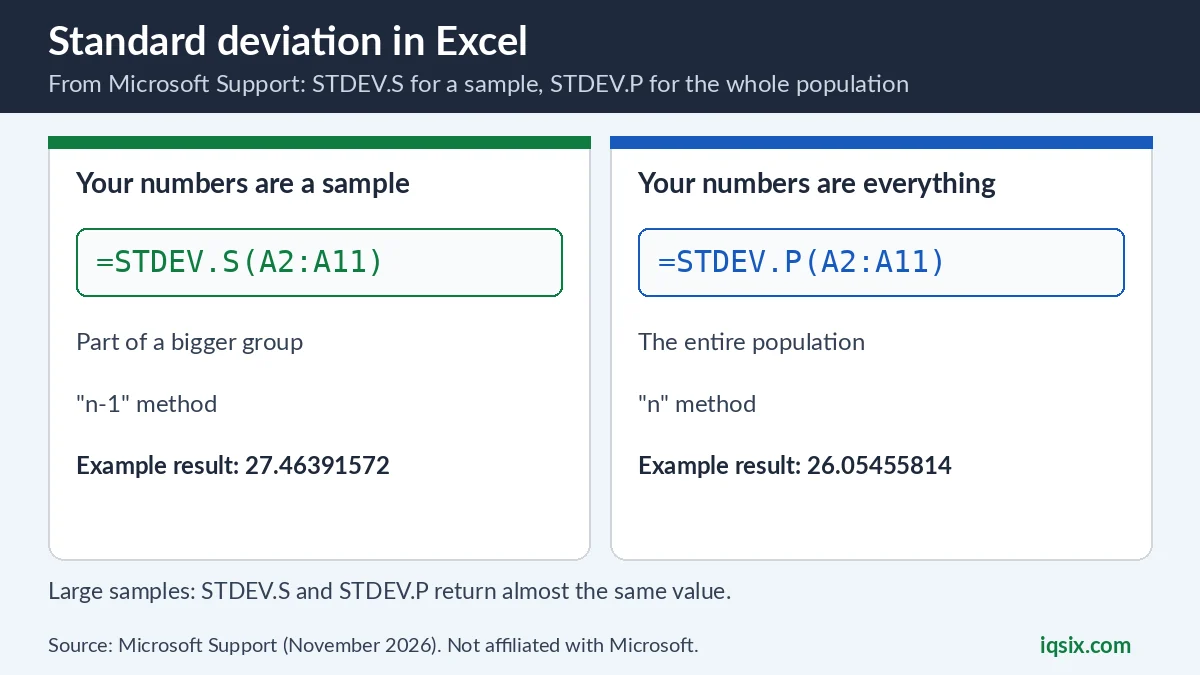
Microsoft defines it in one line: “The standard deviation is a measure of how widely values are dispersed from the average value (the mean)” (Microsoft Support). A small standard deviation means your numbers sit close to their average. A large one means they are spread out.
Excel doesn’t have a button for it. You get it with a function: you type the function name and the cells that hold your numbers, and Excel returns one number, the standard deviation. Which function you use depends on one question: are your numbers a sample, or all the data there is?
How to calculate standard deviation in Excel, step by step

- Put your numbers in one column, one number per cell. In Microsoft’s example they are in cells A2 to A11, with a heading in A1.
- Select an empty cell where you want the result.
- Type =STDEV.S(A2:A11), using your own cell range.
- Press Enter. Excel shows the standard deviation of the numbers in that range.
If your numbers are the entire population, type =STDEV.P(A2:A11) instead. The rest is the same. Copied a formula from a web page and Excel shows it as text? Microsoft’s tip for its examples: select the cell, press F2, and then press Enter.
Example: standard deviation of 10 values
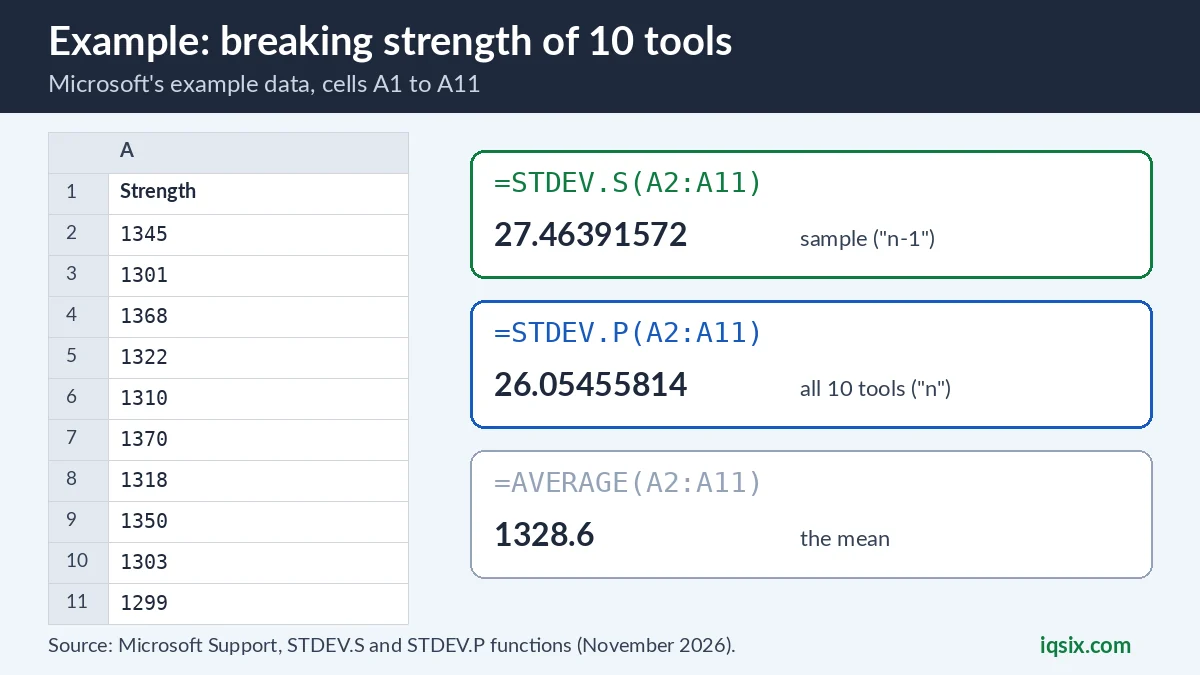
Microsoft uses the same example on its function pages: the breaking strength of 10 tools (STDEV.S, STDEV.P). Put “Strength” in A1 and these numbers in A2 to A11:
| Cells | Values |
|---|---|
| A1 | Strength (heading) |
| A2 to A6 | 1345, 1301, 1368, 1322, 1310 |
| A7 to A11 | 1370, 1318, 1350, 1303, 1299 |
Then try both functions:
| Formula | What it calculates | Result |
|---|---|---|
| =STDEV.S(A2:A11) | Standard deviation of breaking strength, treating the 10 tools as a sample | 27.46391572 |
| =STDEV.P(A2:A11) | Standard deviation, assuming only these 10 tools are produced (the whole population) | 26.05455814 |
| =AVERAGE(A2:A11) | The mean the standard deviation is measured from | 1328.6 |
Same numbers, two different answers. That is not a mistake: STDEV.S divides by one less than the number of values, so its result is a little larger. The next section explains when to use which.
STDEV.S or STDEV.P: which standard deviation should you use?
Microsoft’s rule is simple (STDEV.S, STDEV.P):
- STDEV.S assumes that your numbers are a sample of the population. It uses the “n-1” method.
- STDEV.P assumes that your numbers are the entire population. It uses the “n” method.
Ask yourself whether your list contains every value you care about. A few examples:
| Your data | Use | Why |
|---|---|---|
| 10 tools tested from a large production run | STDEV.S | The 10 tools stand for many more |
| Every one of the 10 tools that were made | STDEV.P | Microsoft’s own example of a whole population |
| Answers from 200 customers out of thousands | STDEV.S | A sample of all your customers |
| The test scores of every student in one class, for that class only | STDEV.P | You have all the values |
Not sure? STDEV.S is the usual choice for measurements and surveys, because you rarely have every possible value. And the choice matters less as your list grows: Microsoft notes that for large sample sizes, STDEV.S and STDEV.P return approximately equal values.
All standard deviation functions in Excel
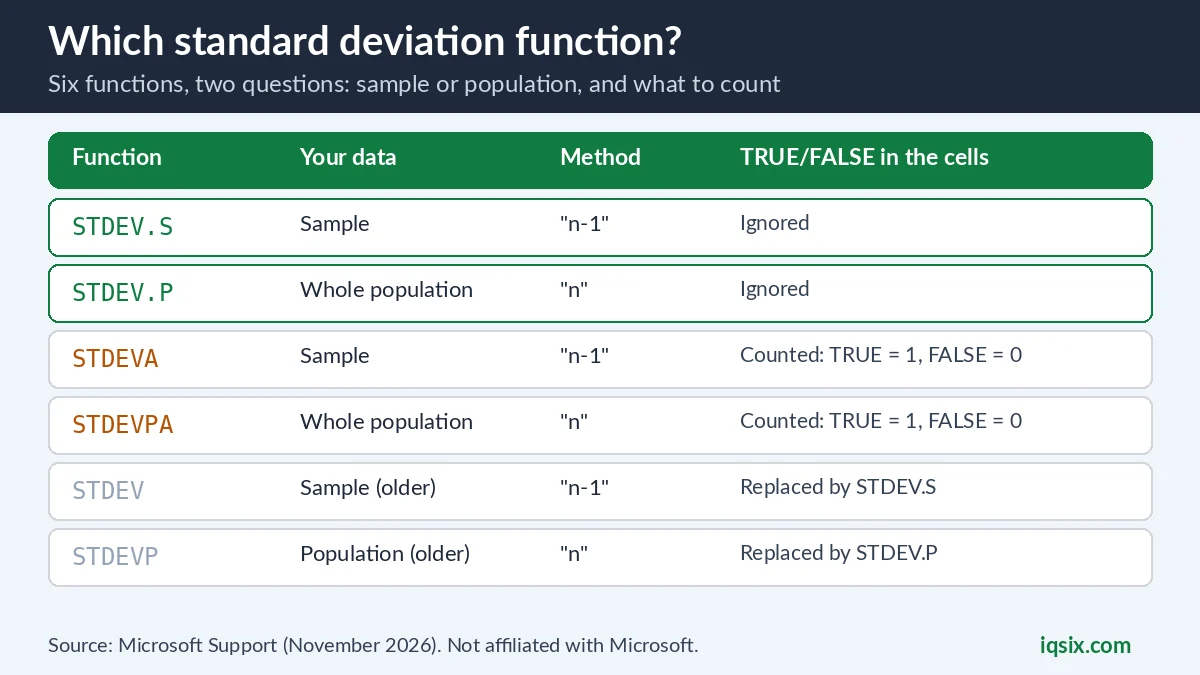
Excel has six standard deviation functions. Two are the ones you’ll normally use, two count logical values too, and two are older versions kept for compatibility:
| Function | Your data | Method | TRUE and FALSE in the cells |
|---|---|---|---|
| STDEV.S | A sample | “n-1” | Ignored |
| STDEV.P | The entire population | “n” | Ignored |
| STDEVA | A sample | “n-1” | Counted: TRUE = 1, FALSE = 0 |
| STDEVPA | The entire population | “n” | Counted: TRUE = 1, FALSE = 0 |
| STDEV | A sample (older function) | “n-1” | Ignored; replaced by STDEV.S |
| STDEVP | The entire population (older function) | “n” | Replaced by STDEV.P |
About the older functions, Microsoft says STDEV and STDEVP have been replaced with new functions “that may provide improved accuracy and whose names better reflect their usage”. They still work for backward compatibility, but Microsoft suggests using the new functions, because the old ones “may not be available in future versions of Excel”.
The standard deviation formula Excel uses
You don’t need the math to use the functions, but it helps to know what Excel does. Microsoft shows the formula on each function page, where x̄ is the sample mean, AVERAGE(number1,number2,…), and n is the sample size (Microsoft Support):
STDEV.S = square root of ( sum of (x - x̄)² ) / (n - 1)
STDEV.P = square root of ( sum of (x - x̄)² ) / n
In words: Excel takes how far each number is from the average, squares those distances, adds them up, divides by n − 1 (a sample) or n (a population), and takes the square root.
Want to work out the standard deviation by hand in Excel, to check it? The DEVSQ function returns the sum of squares of deviations of data points from their sample mean, the top part of the formula. With Microsoft’s example data:
=SQRT(DEVSQ(A2:A11)/(COUNT(A2:A11)-1))   returns 27.46391572, the same as STDEV.S
=SQRT(DEVSQ(A2:A11)/COUNT(A2:A11))       returns 26.05455814, the same as STDEV.P
Standard deviation of several ranges or typed numbers
You aren’t limited to one block of cells. STDEV.S and STDEV.P accept up to 254 more number arguments after the first, separated by commas, and each one can be a single number, a cell range or an array (Microsoft Support). For example:
=STDEV.S(A2:A11, C2:C11)
=STDEV.S(1345, 1301, 1368, 1322)
The first formula treats the numbers in both ranges as one sample. The second uses numbers typed straight into the formula.
What STDEV.S and STDEV.P count and ignore
The rules are the same for both functions (STDEV.S, STDEV.P):
- In a cell range: only numbers are counted. Empty cells, logical values (TRUE, FALSE) and text in the range are ignored.
- Typed into the formula: logical values and text representations of numbers that you type directly into the list of arguments are counted.
- Errors: arguments that are error values, or text that cannot be translated into numbers, cause errors.
Want TRUE, FALSE and numbers stored as text in your cells to count? Use STDEVA (sample) or STDEVPA (population) instead. Microsoft says arguments that contain TRUE evaluate as 1 and arguments that contain text or FALSE evaluate as 0 (STDEVA).
Standard deviation in Excel for Mac
Nothing changes on a Mac. Microsoft lists STDEV.S, STDEV.P and the other standard deviation functions for Excel for Microsoft 365 for Mac, Excel 2024 for Mac and Excel 2021 for Mac (Microsoft Support). Type the same formula, for example =STDEV.S(A2:A11), and press Return.
Standard deviation in Excel not working? Quick fixes
- The result doesn’t match another tool: check sample versus population. STDEV.S and STDEV.P give different results for the same numbers.
- Some numbers seem to be left out: numbers stored as text, logical values and empty cells in the range are ignored. Make sure the cells hold real numbers, or use STDEVA to include text representations of numbers.
- Excel shows the formula, not the result: select the cell, press F2, then press Enter.
- You get an error: text that can’t be turned into a number, typed directly into the formula, causes an error. Check what is between the brackets.
- An old workbook uses STDEV: it still works. For new formulas, use STDEV.S (or STDEV.P instead of STDEVP).
Cleaning up your data first? See how to remove duplicates in Excel, so repeated rows don’t change your standard deviation, and how to strikethrough in Excel to mark values you have checked.
Get Microsoft 365 from IQSIX

Excel comes with Microsoft 365. IQSIX sells a Microsoft 365 Personal 1-year key with Excel, Word, PowerPoint and Outlook: the Excel for Microsoft 365 version this guide covers, on Windows and Mac.
- Redeem: enter the key at microsoft365.com/setup with your Microsoft account (see how to redeem a Microsoft 365 product key).
- Delivery: by email after your payment is confirmed (or on WhatsApp if you ask).
- Payment: crypto, card, or a Remitly bank or mobile money transfer at checkout.
- Questions first? Ask us on WhatsApp or through our contact page.
Not sure which Office to pick? Read Microsoft 365 vs Office 2024, or see all our software keys.
Standard deviation in Excel: FAQ
How do I calculate standard deviation in Excel?
Select an empty cell, type =STDEV.S( followed by the cells with your numbers and a closing bracket, for example =STDEV.S(A2:A11), and press Enter. Use =STDEV.P instead if your numbers are the entire population.
What is the difference between STDEV.S and STDEV.P?
STDEV.S assumes your numbers are a sample and uses the “n-1” method. STDEV.P assumes they are the entire population and uses the “n” method. For large sample sizes they return approximately equal values.
Which standard deviation should I use in Excel?
Use STDEV.S unless your list contains every value in the group you are describing. Then use STDEV.P.
How do I find the standard deviation of several ranges in Excel?
Separate the ranges with commas, for example =STDEV.S(A2:A11, C2:C11). STDEV.S accepts up to 254 more number arguments after the first.
Does STDEV.S count empty cells, text or TRUE and FALSE?
No. In a cell range, only numbers are counted; empty cells, logical values and text are ignored. Use STDEVA to count TRUE as 1 and FALSE as 0.
Is STDEV the same as STDEV.S?
STDEV is the older function for a sample and also uses the “n-1” method. Microsoft has replaced it with STDEV.S; STDEV still works for backward compatibility but may not be available in future versions.
Sources, checked 2 November 2026: Microsoft Support – STDEV.S function, STDEV.P function, STDEVA function, STDEVPA function, STDEV function, STDEVP function and DEVSQ function. IQSIX is not affiliated with Microsoft.